Members - Faculty, students, and collaborators |
News - Recent news and publicty from members of the IDEA lab |
| Theses and Dissertations - Publications and code releases for student theses and disserations |
| Publications - Recent technical papers and presentations |
Software - Recent software releases |
This page contains the files referenced in our ICDM 2008 workshop paper.
- Code:
- Sample data:
Updated Results
In the process of running scenarios we encountered a most interesting observation. In running the Least Squares Support Vector Machine (LSSVM) as described by Suykens (2000) against random data generated across a normal distribution, we were witnessing much higher skills than we anticipated. Using the Hanssen and Kuipers (HK) discriminant (which determines how well we are separating the true positives from the false positives) we found skills of 0.48 where 0.00 should demonstrate no skill. Naturally, this caused us to withdraw all of our results as our confidence in them faded. Ultimately, we tested the code against a well-known matlab implementation available on Suykens' website and found that our code was giving the same answers as an acceptable standard implementation of the algorithm.
We thus concluded that it is not our implementation of the LSSVM that is causing the issue. In fact, it appears as though the issue is the question itself that we are asking. The question was not appropriate for the data. In our study, we were attempting to predict a future state of drought in the central cell of a gridded geographic window by looking at the spatial pattern of drought around the central cell. The specific question being asked was, "Given the pattern of drought conditions at a particular time, will drought conditions increase or decrease in the next time step?" Upon reflection, it would appear as though this question can be asked with skill against a random data set for one simple reason. Since the data is a random number (varying between about +/-2.3) the LSSVM can guess that the next value will be closer to zero and be right a significant number of times.
We then asked a more neutral question, "Will the drought value be above zero on the next time step?" and found that the algorithm only had a skill of -0.06 in answering that question. This is understandable as the LSSVM could never determine with any probability that the next value would be greater than or less than zero. As we varied the question to seek for drought values above some non-zero threshold, say -1.7, the algorithm continued to provide little to no skill. However, as can be seen in Table 1, the number of predicted no's slowly decreased, and eventually the number of false positives also decreased until the algorithm was always predicting better conditions. This is to be expected because the more extreme the threshold, the more often the machine will predict that conditions will be better. Due to the way the HK skill test discriminates between the two columns of the contingency table, the HK value simply hovers near zero. These experiments suggest that the LSSVM, which is very good at recognizing patterns, is simply finding the structure in the data with relation to the question being asked.
| Will next time step be greater than this value? | True Positives | False Positives | False Negatives | True Negatives | HK Score |
| 0.0 | 46 | 60 | 66 | 68 | -0.06 |
| -0.1 | 86 | 88 | 35 | 31 | -0.03 |
| -0.3 | 138 | 100 | 1 | 1 | 0.00 |
| -0.7 | 176 | 64 | 0 | 0 | 0.00 |
| -1.0 | 199 | 41 | 0 | 0 | 0.00 |
| -1.3 | 222 | 18 | 0 | 0 | 0.00 |
| -1.7 | 231 | 9 | 0 | 0 | 0.00 |
| -2.0 | 234 | 6 | 0 | 0 | 0.00 |
| -2.3 | 238 | 2 | 0 | 0 | 0.00 |
| -2.7 | 240 | 0 | 0 | 0 | NaN |
Table 1: Skill as a function of the question asked on random data |
|||||
We followed up using the question of whether or not the drought value was below zero or not on the next time step on the real drought data. We found that the skill remained near zero (absolute value less than 0.10) for the geographic window sizes we tested (3,5,7,9, and 11 grid cells in width).
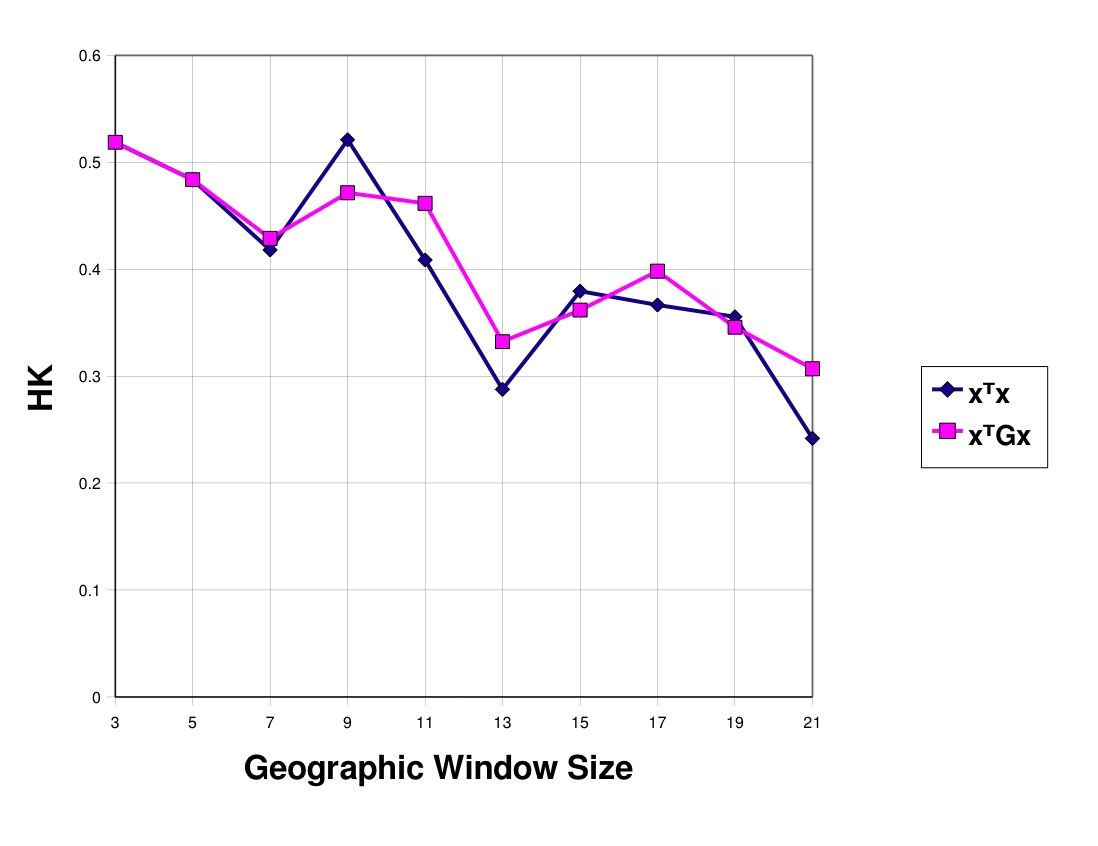 |
| Figure 1: Skill at predicting real-world drought as a function of geographic window size. |
We provide, in Figure 1, our results on real drought data while using the standard linear kernel as compared to using our Gaussian Hat kernel. The fact that the skill begins at about 0.5 for small geographic window size and then slowly decreases implies that the results of the cases above are indpendent from this case with real data with the original question. In other words, the findings above of skill for the random data case were only possible because of structure in the data with respect to the question being asked. In Figure 1, we feel that the skill being demonstrated is a direct result of the the LSSVM being able to discern patterns in the data with respect to the question being asked as well. In specific, the question being asked in Figure 1 is the original question of, "Given the pattern of drought conditions at a particular time, will drought conditions increase or decrease in the next time step?" It is appears that the Gaussian Hat kernel, in general, provides greater skill than the simple linear kernel. Furthermore, it seems as though Tobler's First Law of Geography also holds true as the smaller geographic window size does a better job at predicting the future state of drought at this particular location.
Since it is in our long-term research agenda to aid in a deeper understanding of real drought, further consultations and effort are being applied to refine the questions we are asking and we will be testing their efficacy against both simuilated and real drought data.